The 2018 NCAA Men’s Volleyball Champions from Long Beach State set an NCAA Division I modern-era record by hitting .375 on the season. That broke the old record of .366 that was set by Long Beach State just last season.
Their relative success meant that they had the high hitting percentage on relatively-few attacks – they had just 2,621 this seaosn, which ranked them 26th out of 42 teams nationally. UCLA, who was 2nd in hitting percentage nationally (.350) had 3,326 attacks; while Ohio State, who was 3rd nationally (.343) had 3,191 attacks. Hawaii had only 2,550 attacks to hit .333, but also played 2 fewer games on the season.
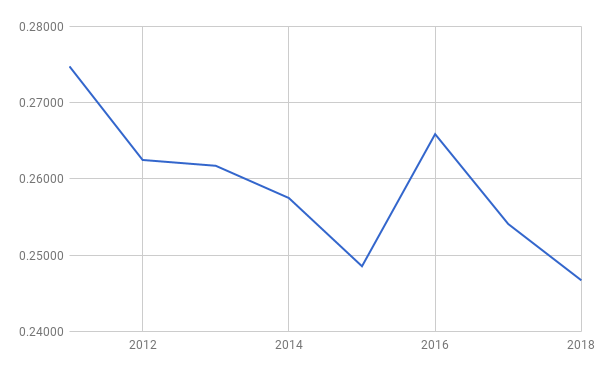
In spite of Long Beach State’s individual success, national hitting percentages were down this year. The national average of .247 was the lowest that it has been since before the NCAA instituted a 25-point rally-scoring format in 2011 (and larger trends indicate that it might be the lowest ever, though there’s not enough data to say that definitively).
See the data below:
| Year | National Hitting Percentage |
| 2011 | 0.275 |
| 2012 | 0.262 |
| 2013 | 0.262 |
| 2014 | 0.257 |
| 2015 | 0.249 |
| 2016 | 0.266 |
| 2017 | 0.254 |
| 2018 | 0.247 |
There are a few plausible explanations for this trend over the last 9 seasons, and the broader one that sees lower hitting percentages in the 25-point rally scoring era, where matches are generally shorter, than in other eras.
The most likely one is increased emphasis on aggressive serving. In men’s volleyball, where floor defense is minimized because of the power of attacks, serve and serve-receive can become a primary driver of lowered hitting percentages, because tougher serving leads to poorer passes, leads to less effective hitting.
One theory floated around our shop was that hitters have become more aggressive. The data doesn’t seem to bear this out, however; errors are at best flat, and arguably lower, than they were a decade ago, and one would expect that any change in hitting aggression that lowered hitting percentages would do so because of an increase in errors.
If errors aren’t the explanation, that means that swings and/or kills have to have gone up (that’s just math).
An intuitive way for that to happen is an improvement in floor defense, caused by bigger blocks. But, ‘counted’ block numbers are also down from 10 years ago, to the tune of almost 80 per team. While blocks that don’t score points don’t show up in the statistics, one would expect that if tips are up as a result of a tougher block, then actual blocks would be too. If tips are up as a result of less-skilled hitters, then that wouldn’t necessarily imply the same jump in scoring blocks.
Legendary UCLA coach Al Scates once set up an entire talk on how floor defense is the least important part of men’s volleyball. His practices focused on serve receive, block, and attack in that order. Maybe there’s a shift in attitude that has allowed more focus on floor defense, to the extent that it has driven down hitting percentages? But, only improved to the extent that balls are dug and passed, but not necessarily passed well enough to where there would be a countering increasing in hitting percentage caused by better passing? But that still leaves an opening that worse floor defense could improve hitting percentages, if we ignore the belief that hitting has become more aggressive.
The explanation could also be simpler. With more teams in the NCAA there is less parity, and less parity means more lopsided matches. This could simply be an effect of coaches’ decisions that in lopsided matches, they decide to reach deeper into their benches for players, and as teams reach deeper into their benches, hitting percentages drop. That would be a really difficult pile of statistics to compile and trend out. I pulled up one example, Long Beach State’s season-opener against McKendree, where Long Beach State hit below their season average (.333) in a match against a team that ranked in the bottom-half of the country in opponents’ hitting percentage, and Long Beach State’s best hitters (Kyle Ensing, TJ DeFalco) hit well below their season averages (.271, .263). That’s just one example, but barring assembly of a complete, organized database of game-by-game box scores, that one would be really challenging to parse out statistically.
Data that we can see, however, that might debate the above point, is that the spread on teams’ offensive hitting percentages (.135 to .375) is far greater than the spread on teams’ opponents hitting percentages (.156 to .314). That means that the disparity between teams’ efficiency on offense is greater than the disparity between teams’ efficiency on defense, given a pretty large sample size.
What do we know for sure? Offensive hitting percentages are down. Everything else is a cloud of hunches and statistical suspicions. But, in spite of the bigger trend, LBSU still had a record-breaking season.
Of note, UCLA had the 11th-best season in the modern era. The percentages on those .350s are in order, and excruciatingly small in difference: one more kill or one fewer error for UCLA this season would have vaulted them up to 9th place. Long Beach State this year had a little more breathing room: they were a net-kills number of 22 better than last year’s team (adjusted for total attacks), just under 1-per-game.
Hitting Percentages, Modern Era (2011-2018), .350 or better
| Rank | School | Year | Kills | Errors | Attacks | Hitting Percentage |
| 1 | Long Beach State | 2018 | 1292 | 310 | 2621 | 0.375 |
| 2 | Long Beach State | 2017 | 1397 | 365 | 2817 | 0.366 |
| 3 | Loyola Chicago | 2014 | 1482 | 433 | 2867 | 0.366 |
| 4 | Ohio State | 2017 | 1557 | 458 | 3015 | 0.365 |
| 5 | BYU | 2016 | 1378 | 373 | 2792 | 0.360 |
| 6 | Mount Olive | 2011 | 1238 | 420 | 2294 | 0.357 |
| 7 | UC Irvine | 2012 | 1613 | 452 | 3277 | 0.354 |
| 8 | USC | 2011 | 1430 | 407 | 2913 | 0.351 |
| 9 | UC Irvine | 2016 | 1719 | 529 | 3399 | 0.350 |
| 10 | Ohio State | 2016 | 1558 | 472 | 3103 | 0.350 |
| 11 | UCLA | 2018 | 1635 | 471 | 3326 | 0.350 |
| 12 | Loyola Chicago | 2015 | 1358 | 416 | 2693 | 0.350 |