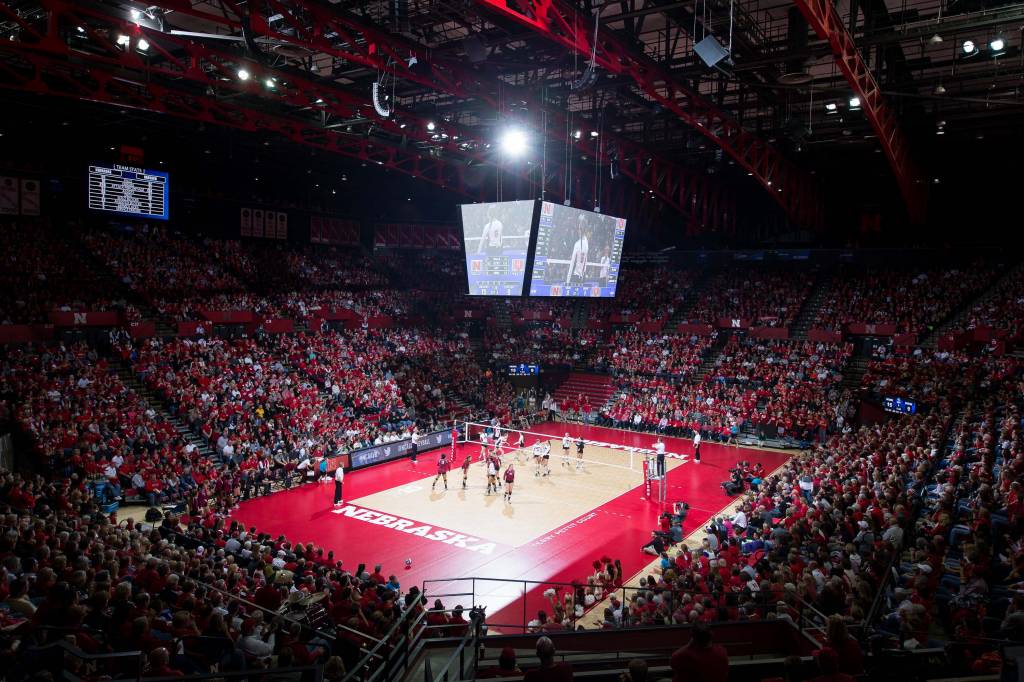
For the 4th-straight season, the Nebraska Cornhuskers have ended the NCAA regular season as the national leaders in home attendance.
Nebraska, who have the highest ticket prices in the nation for volleyball, averaged 8,208 fans per game at the DeVaney Center this season. That’s 103.39% of the listed stadium capacity of 7,907. The 2nd-ranked team, Hawaii, drew 6,396 fans per game – meaning Nebraska’s average home crowd was 28% higher than Hawaii’s this season.
Hawaii’s attendance dropped from last year, down from 6,759 last season. The top 5 teams, rounded out by Wisconsin (5,980), Minnesota (5,029) and Penn State (3,615) remained the same from last year – with 4 of them coming from the Big Ten.
The Big Ten, while still easily the dominant team in these rankings, did see an overall drop in rank from last year (though they still improved overall). Only 5 of the top 11 teams in average home attendance this season are from the Big Ten. Last year, 6 of the top 7 came from the Big Ten.
The next best team not in the Big Ten (or Hawaii) is Texas, who checked in at #6 with 3,561 fans per game – up from 2,434 last season.
Among the biggest movers this year was Florida, who saw home attendance jump from 744 last year to 3,305. That’s primarily due to their return to campus at the newly-renovated O’Connell Center, including a huge crowd for their first game back.
Also making a big move was Cal Poly, who won the Big West title and spent much of the season ranked in the top 25. The Mustangs were 26-2 overall this year, and that turned in to them more than doubling their 2016 attendance from 939 fans per game to 2,044 fans per game.
The full rankings as of the end of the regular season is below.
| Rank | Institution | Conference | Accum Attendance | Avg Attendance | 2016 Avg. Attendance | Change in Avg. Attendance |
| 1 | Nebraska | Big Ten | 123,116 | 8,208 | 8210 | -2 |
| 2 | Hawaii | Big West | 121,523 | 6,396 | 6759 | -363 |
| 3 | Wisconsin | Big Ten | 95,680 | 5,980 | 5927 | 53 |
| 4 | Minnesota | Big Ten | 65,380 | 5,029 | 4835 | 194 |
| 5 | Penn St. | Big Ten | 46,999 | 3,615 | 3385 | 230 |
| 6 | Texas | Big 12 | 39,173 | 3,561 | 2434 | 1,127 |
| 7 | Florida | Southeastern | 49,578 | 3,305 | 744 | 2,561 |
| 8 | Michigan St. | Big Ten | 40,834 | 3,141 | 2994 | 147 |
| 9 | North Carolina | Atlantic Coast | 40,226 | 2,873 | 2100 | 773 |
| 10 | Wichita St. | AAC | 29,701 | 2,700 | 2264 | 436 |
| 11 | Colorado St. | Mountain West | 48,698 | 2,563 | 2245 | 318 |
| 12 | Illinois | Big Ten | 30,287 | 2,524 | 2586 | -62 |
| 13 | Iowa St. | Big 12 | 32,431 | 2,495 | 2426 | 69 |
| 14 | UNI | Missouri Valley | 24,376 | 2,438 | 2086 | 352 |
| 15 | Purdue | Big Ten | 35,749 | 2,383 | 2537 | -154 |
| 16 | Stanford | Pac-12 | 25,884 | 2,353 | 1847 | 506 |
| 17 | Washington | Pac-12 | 37,071 | 2,317 | 2259 | 58 |
| 18 | Kentucky | Southeastern | 30,086 | 2,149 | 1553 | 596 |
| 19 | BYU | West Coast | 27,915 | 2,147 | 1895 | 252 |
| 20 | Cal Poly | Big West | 16,352 | 2,044 | 939 | 1,105 |
| 21 | Utah | Pac-12 | 28,398 | 2,028 | 1447 | 581 |
| 22 | Creighton | Big East | 19,414 | 1,765 | 1235 | 530 |
| 23 | Iowa | Big Ten | 29,983 | 1,764 | 1918 | -154 |
| 24 | Kansas St. | Big 12 | 20,183 | 1,682 | 2121 | -439 |
| 25 | Michigan | Big Ten | 26,401 | 1,650 | 1439 | 211 |
| 26 | Oregon | Pac-12 | 25,870 | 1,617 | 1625 | -8 |
| 27 | Missouri | Southeastern | 14,394 | 1,599 | 2547 | -948 |
| 28 | TCU | Big 12 | 22,097 | 1,578 | 1557 | 21 |
| 29 | Texas A&M | Southeastern | 21,811 | 1,558 | 1718 | -160 |
| 30 | Southern California | Pac-12 | 18,460 | 1,538 | 727 | 811 |
| 31 | Arizona | Pac-12 | 24,356 | 1,522 | 1430 | 92 |
| 32 | Omaha | Summit League | 14,568 | 1,457 | 515 | 942 |
| 33 | Maryland | Big Ten | 22,637 | 1,415 | 1148 | 267 |
| 34 | North Dakota | Big Sky | 16,787 | 1,399 | 1090 | 309 |
| 35 | Ohio St. | Big Ten | 23,391 | 1,376 | 1714 | -338 |
| 36 | UCLA | Pac-12 | 15,057 | 1,369 | 1388 | -19 |
| 37 | Georgia | Southeastern | 20,076 | 1,338 | 792 | 546 |
| 38 | Arizona St. | Pac-12 | 17,101 | 1,315 | 1653 | -338 |
| 39 | Colorado | Pac-12 | 18,291 | 1,307 | 1601 | -294 |
| 40 | Kansas | Big 12 | 15,624 | 1,302 | 1283 | 19 |
| 41 | South Carolina | Southeastern | 19,400 | 1,293 | 1094 | 199 |
| 42 | LSU | Southeastern | 11,686 | 1,169 | 928 | 241 |
| 43 | Oregon St. | Pac-12 | 15,015 | 1,155 | 949 | 206 |
| 44 | Clemson | Atlantic Coast | 18,488 | 1,088 | 903 | 185 |
| 45 | Baylor | Big 12 | 16,183 | 1,079 | 683 | 396 |
| 46 | Missouri St. | Missouri Valley | 13,920 | 1,071 | 851 | 220 |
| 47 | NC State | Atlantic Coast | 14,835 | 1,060 | 1082 | -22 |
| 48 | Duke | Atlantic Coast | 15,516 | 1,034 | 1388 | -354 |
| 49 | Grand Canyon | Western Athletic | 10,007 | 1,001 | 712 | 289 |
| 50 | Arkansas | Southeastern | 12,919 | 994 | 828 | 166 |
| 51 | Louisville | Atlantic Coast | 13,326 | 952 | 1965 | -1013 |
| 52 | Texas St. | Sun Belt | 13,133 | 938 | 902 | 36 |
| 53 | Long Beach St. | Big West | 13,083 | 935 | 1034 | -99 |
| 54 | Florida St. | Atlantic Coast | 12,929 | 924 | 1120 | -196 |
| 55 | Southern Utah | Big Sky | 9,158 | 916 | 394 | 522 |
| 56 | Incarnate Word | Southland | 7,222 | 903 | 323 | 580 |
| 57 | Notre Dame | Atlantic Coast | 15,335 | 902 | 1005 | -103 |
| 58 | New Mexico St. | Western Athletic | 13,471 | 898 | 1042 | -144 |
| 59 | Montana St. | Big Sky | 9,599 | 873 | 1044 | -171 |
| 60 | Yale | Ivy League | 9,552 | 868 | 395 | 473 |
| 61 | Wyoming | Mountain West | 12,913 | 861 | 817 | 44 |
| 62 | Marquette | Big East | 10,981 | 845 | 740 | 105 |
| 63 | New Mexico | Mountain West | 10,821 | 832 | 1248 | -416 |
| 64 | Northwestern | Big Ten | 8,303 | 830 | 962 | -132 |
| 65 | UTSA | Conference USA | 6,608 | 826 | 611 | 215 |
| 66 | Washington St. | Pac-12 | 11,491 | 821 | 1169 | -348 |
| 67 | Virginia Tech | Atlantic Coast | 9,822 | 819 | 684 | 135 |
| 68 | Illinois St. | Missouri Valley | 11,307 | 808 | 997 | -189 |
| 69 | Northern Colo. | Big Sky | 11,284 | 806 | 920 | -114 |
| 70 | Fresno St. | Mountain West | 8,008 | 801 | 798 | 3 |
| 71 | Kennesaw St. | ASUN | 7,968 | 797 | 651 | 146 |
| 72 | Indiana | Big Ten | 12,487 | 780 | 881 | -101 |
| 73 | San Diego | West Coast | 10,087 | 776 | 536 | 240 |
| 74 | Alabama | Southeastern | 11,632 | 775 | 873 | -98 |
| 75 | North Dakota St. | Summit League | 9,147 | 762 | 752 | 10 |
| 76 | Boise St. | Mountain West | 11,297 | 753 | 780 | -27 |
| 77 | South Dakota | Summit League | 5,232 | 747 | 851 | -104 |
| 78 | Oklahoma | Big 12 | 8,210 | 746 | 799 | -53 |
| 79 | UTRGV | Western Athletic | 8,861 | 738 | 731 | 7 |
| 80 | Utah Valley | Western Athletic | 8,751 | 729 | 761 | -32 |
| 81 | California | Pac-12 | 12,248 | 720 | 695 | 25 |
| 82 | Auburn | Southeastern | 8,624 | 719 | 815 | -96 |
| 83 | UT Arlington | Sun Belt | 11,315 | 707 | 727 | -20 |
| 84 | Tennessee | Southeastern | 10,603 | 707 | 963 | -256 |
| 85 | Xavier | Big East | 9,678 | 691 | 726 | -35 |
| 86 | Utah St. | Mountain West | 8,905 | 685 | 1013 | -328 |
| 87 | West Virginia | Big 12 | 8,225 | 685 | 521 | 164 |
| 88 | Charlotte | Conference USA | 8,687 | 668 | 582 | 86 |
| 89 | Texas Tech | Big 12 | 7,762 | 647 | 502 | 145 |
| 90 | Temple | AAC | 7,686 | 641 | 489 | 152 |
| 91 | A&M-Corpus Christi | Southland | 7,052 | 641 | 537 | 104 |
| 92 | Pacific | West Coast | 6,253 | 625 | 762 | -137 |
| 93 | Georgia Tech | Atlantic Coast | 10,540 | 620 | 723 | -103 |
| 94 | FGCU | ASUN | 8,454 | 604 | 526 | 78 |
| 95 | Morgan St. | Mid-Eastern | 4,230 | 604 | 237 | 367 |
| 96 | UNCW | Colonial | 8,338 | 596 | 603 | -7 |
| 97 | Ole Miss | Southeastern | 10,715 | 595 | 770 | -175 |
| 98 | Oral Roberts | Summit League | 5,797 | 580 | 495 | 85 |
| 99 | Liberty | Big South | 6,936 | 578 | 932 | -354 |
| 100 | Southern Ill. | Missouri Valley | 6,361 | 578 | 388 | 190 |
| 101 | Valparaiso | Missouri Valley | 6,340 | 576 | 360 | 216 |
| 102 | Abilene Christian | Southland | 4,575 | 572 | 461 | 111 |
| 103 | Bowling Green | Mid-American | 7,414 | 570 | 567 | 3 |
| 104 | Pittsburgh | Atlantic Coast | 7,402 | 569 | 437 | 132 |
| 105 | Dayton | Atlantic 10 | 6,259 | 569 | 819 | -250 |
| 106 | Virginia | Atlantic Coast | 8,988 | 562 | 683 | -121 |
| 107 | Western Mich. | Mid-American | 5,585 | 559 | 602 | -43 |
| 108 | Marshall | Conference USA | 6,106 | 555 | 512 | 43 |
| 109 | CSU Bakersfield | Western Athletic | 4,417 | 552 | 457 | 95 |
| 110 | Sam Houston St. | Southland | 5,483 | 548 | 283 | 265 |
| 111 | Idaho St. | Big Sky | 4,933 | 548 | 581 | -33 |
| 112 | Gonzaga | West Coast | 6,536 | 545 | 603 | -58 |
| 113 | Ball St. | Mid-American | 7,046 | 542 | 695 | -153 |
| 114 | Col. of Charleston | Colonial | 7,975 | 532 | 421 | 111 |
| 115 | VCU | Atlantic 10 | 6,346 | 529 | 425 | 104 |
| 116 | Miami (FL) | Atlantic Coast | 5,287 | 529 | 394 | 135 |
| 117 | Butler | Big East | 7,850 | 523 | 496 | 27 |
| 118 | Belmont | OVC | 6,752 | 519 | 367 | 152 |
| 119 | Miami (OH) | Mid-American | 7,202 | 514 | 488 | 26 |
| 120 | Northern Ariz. | Big Sky | 5,504 | 500 | 545 | -45 |
| 121 | Campbell | Big South | 5,993 | 499 | 368 | 131 |
| 122 | UNCG | Southern | 8,950 | 497 | 401 | 96 |
| 123 | Idaho | Big Sky | 3,969 | 496 | 465 | 31 |
| 124 | Ohio | Mid-American | 5,890 | 491 | 2106 | -1615 |
| 125 | Kent St. | Mid-American | 4,903 | 490 | 491 | -1 |
| 126 | Montana | Big Sky | 3,896 | 487 | 434 | 53 |
| 127 | Fort Wayne | Summit League | 5,837 | 486 | 483 | 3 |
| 128 | Cincinnati | AAC | 4,323 | 480 | 636 | -156 |
| 129 | Little Rock | Sun Belt | 4,287 | 476 | 436 | 40 |
| 130 | Western Ky. | Conference USA | 7,122 | 475 | 919 | -444 |
| 131 | Drake | Missouri Valley | 6,175 | 475 | 388 | 87 |
| 132 | Radford | Big South | 4,726 | 473 | 292 | 181 |
| 133 | Chattanooga | Southern | 6,606 | 472 | 382 | 90 |
| 134 | SMU | AAC | 7,301 | 456 | 377 | 79 |
| 135 | Santa Clara | West Coast | 5,009 | 455 | 362 | 93 |
| 136 | Northern Ill. | Mid-American | 5,429 | 452 | 549 | -97 |
| 137 | UCF | AAC | 4,977 | 452 | 281 | 171 |
| 138 | Louisiana | Sun Belt | 6,280 | 449 | 297 | 152 |
| 139 | Arkansas St. | Sun Belt | 6,234 | 445 | 417 | 28 |
| 140 | Prairie View | Southwestern | 2,651 | 442 | 159 | 283 |
| 141 | UC Irvine | Big West | 5,231 | 436 | 393 | 43 |
| 142 | Rice | Conference USA | 5,991 | 428 | 462 | -34 |
| 143 | Air Force | Mountain West | 5,519 | 425 | 301 | 124 |
| 144 | Coastal Caro. | Sun Belt | 2,929 | 418 | 421 | -3 |
| 145 | Bradley | Missouri Valley | 7,096 | 417 | 418 | -1 |
| 146 | Troy | Sun Belt | 5,844 | 417 | 598 | -181 |
| 147 | Central Mich. | Mid-American | 4,585 | 417 | 396 | 21 |
| 148 | South Ala. | Sun Belt | 4,949 | 412 | 161 | 251 |
| 149 | East Carolina | AAC | 7,359 | 409 | 521 | -112 |
| 150 | Weber St. | Big Sky | 4,049 | 405 | 398 | 7 |
| 151 | Rutgers | Big Ten | 4,449 | 404 | 246 | 158 |
| 152 | San Jose St. | Mountain West | 4,831 | 403 | 338 | 65 |
| 153 | South Fla. | AAC | 5,137 | 395 | 363 | 32 |
| 154 | Austin Peay | OVC | 5,859 | 391 | 302 | 89 |
| 155 | UMES | Mid-Eastern | 5,077 | 391 | 511 | -120 |
| 156 | Mississippi St. | Southeastern | 6,615 | 389 | 548 | -159 |
| 157 | Villanova | Big East | 5,053 | 389 | 198 | 191 |
| 158 | Louisiana Tech | Conference USA | 3,870 | 387 | 279 | 108 |
| 159 | Davidson | Atlantic 10 | 3,853 | 385 | 438 | -53 |
| 160 | UC Davis | Big West | 4,557 | 380 | 404 | -24 |
| 161 | Central Ark. | Southland | 5,305 | 379 | 275 | 104 |
| 162 | CSUN | Big West | 4,167 | 379 | 505 | -126 |
| 163 | Milwaukee | Horizon | 4,914 | 378 | 322 | 56 |
| 164 | Sacramento St. | Big Sky | 4,889 | 376 | 305 | 71 |
| 165 | New Hampshire | America East | 3,746 | 375 | 394 | -19 |
| 166 | Navy | Patriot | 4,488 | 374 | 392 | -18 |
| 167 | Cleveland St. | Horizon | 3,736 | 374 | 288 | 86 |
| 168 | Ga. Southern | Sun Belt | 4,476 | 373 | 271 | 102 |
| 169 | Seton Hall | Big East | 4,470 | 373 | 306 | 67 |
| 170 | Boston College | Atlantic Coast | 5,952 | 372 | 308 | 64 |
| 171 | Green Bay | Horizon | 3,709 | 371 | 360 | 11 |
| 172 | Houston Baptist | Southland | 3,675 | 368 | 294 | 74 |
| 173 | North Florida | ASUN | 3,666 | 367 | 303 | 64 |
| 174 | North Texas | Conference USA | 5,497 | 366 | 429 | -63 |
| 175 | UNC Asheville | Big South | 3,282 | 365 | 276 | 89 |
| 176 | Princeton | Ivy League | 2,893 | 362 | 479 | -117 |
| 177 | Portland St. | Big Sky | 2,885 | 361 | 248 | 113 |
| 178 | Loyola Chicago | Missouri Valley | 4,678 | 360 | 338 | 22 |
| 179 | Furman | Southern | 3,238 | 360 | 402 | -42 |
| 180 | Samford | Southern | 4,295 | 358 | 283 | 75 |
| 181 | Akron | Mid-American | 3,918 | 356 | 318 | 38 |
| 182 | South Dakota St. | Summit League | 3,514 | 351 | 387 | -36 |
| 183 | Wake Forest | Atlantic Coast | 4,520 | 348 | 225 | 123 |
| 184 | UNLV | Mountain West | 5,534 | 346 | 451 | -105 |
| 185 | Wright St. | Horizon | 3,800 | 345 | 323 | 22 |
| 186 | UT Martin | OVC | 2,751 | 344 | 286 | 58 |
| 187 | San Diego St. | Mountain West | 5,114 | 341 | 313 | 28 |
| 188 | Quinnipiac | Metro Atlantic | 3,068 | 341 | 341 | 0 |
| 189 | Northwestern St. | Southland | 3,057 | 340 | 277 | 63 |
| 190 | Loyola Marymount | West Coast | 4,383 | 337 | 550 | -213 |
| 191 | High Point | Big South | 4,685 | 335 | 653 | -318 |
| 192 | Elon | Colonial | 4,654 | 332 | 313 | 19 |
| 193 | Southeast Mo. St. | OVC | 3,974 | 331 | 288 | 43 |
| 194 | Bryant | Northeast | 4,295 | 330 | 187 | 143 |
| 195 | Fordham | Atlantic 10 | 3,294 | 329 | 300 | 29 |
| 196 | Wofford | Southern | 2,946 | 327 | 284 | 43 |
| 197 | UConn | AAC | 4,541 | 324 | 351 | -27 |
| 198 | American | Patriot | 5,793 | 322 | 372 | -50 |
| 199 | SFA | Southland | 4,174 | 321 | 308 | 13 |
| 200 | Evansville | Missouri Valley | 3,809 | 317 | 205 | 112 |
| 201 | Lipscomb | ASUN | 4,090 | 315 | 331 | -16 |
| 202 | Toledo | Mid-American | 4,389 | 314 | 431 | -117 |
| 203 | Southern Miss. | Conference USA | 4,062 | 312 | 346 | -34 |
| 204 | Delaware | Colonial | 2,483 | 310 | 408 | -98 |
| 205 | Morehead St. | OVC | 4,604 | 307 | 484 | -177 |
| 206 | USC Upstate | ASUN | 2,149 | 307 | 136 | 171 |
| 207 | Pepperdine | West Coast | 4,579 | 305 | 412 | -107 |
| 208 | Nevada | Mountain West | 3,917 | 301 | 380 | -79 |
| 209 | IUPUI | Horizon | 3,610 | 301 | 254 | 47 |
| 210 | Memphis | AAC | 3,602 | 300 | 410 | -110 |
| 211 | Tulsa | AAC | 3,263 | 297 | 267 | 30 |
| 212 | Alabama A&M | Southwestern | 1,783 | 297 | 157 | 140 |
| 213 | UC Riverside | Big West | 3,260 | 296 | 295 | 1 |
| 214 | Bethune-Cookman | Mid-Eastern | 2,366 | 296 | 280 | 16 |
| 215 | Portland | West Coast | 4,432 | 295 | 337 | -42 |
| 216 | Saint Louis | Atlantic 10 | 3,821 | 294 | 357 | -63 |
| 217 | Buffalo | Mid-American | 3,208 | 292 | 231 | 61 |
| 218 | Lamar University | Southland | 2,627 | 292 | 288 | 4 |
| 219 | Fairfield | Metro Atlantic | 4,001 | 286 | 211 | 75 |
| 220 | Middle Tenn. | Conference USA | 2,828 | 283 | 231 | 52 |
| 221 | UC Santa Barbara | Big West | 3,080 | 280 | 256 | 24 |
| 222 | St. John’s (NY) | Big East | 4,191 | 279 | 263 | 16 |
| 223 | Rider | Metro Atlantic | 3,342 | 279 | 217 | 62 |
| 224 | Colgate | Patriot | 3,045 | 277 | 361 | -84 |
| 225 | Houston | AAC | 4,134 | 276 | 389 | -113 |
| 226 | DePaul | Big East | 3,263 | 272 | 495 | -223 |
| 227 | Tulane | AAC | 5,148 | 271 | 179 | 92 |
| 228 | Ill.-Chicago | Horizon | 3,175 | 265 | 247 | 18 |
| 229 | Mississippi Val. | Southwestern | 1,833 | 262 | 164 | 98 |
| 230 | Oakland | Horizon | 2,875 | 261 | 383 | -122 |
| 231 | SIUE | OVC | 3,636 | 260 | 307 | -47 |
| 232 | Northern Ky. | Horizon | 2,839 | 258 | 265 | -7 |
| 233 | George Washington | Atlantic 10 | 3,597 | 257 | 265 | -8 |
| 234 | Cornell | Ivy League | 2,567 | 257 | 244 | 13 |
| 235 | Mercer | Southern | 2,820 | 256 | 358 | -102 |
| 236 | UTEP | Conference USA | 3,510 | 251 | 583 | -332 |
| 237 | Syracuse | Atlantic Coast | 3,453 | 247 | 257 | -10 |
| 238 | Murray St. | OVC | 2,221 | 247 | 419 | -172 |
| 239 | Tennessee Tech | OVC | 1,957 | 245 | 311 | -66 |
| 240 | James Madison | Colonial | 4,140 | 244 | 406 | -162 |
| 241 | Penn | Ivy League | 2,169 | 241 | 234 | 7 |
| 242 | Ark.-Pine Bluff | Southwestern | 1,199 | 240 | 114 | 126 |
| 243 | Alabama St. | Southwestern | 3,818 | 239 | 182 | 57 |
| 244 | Indiana St. | Missouri Valley | 2,628 | 239 | 264 | -25 |
| 245 | Georgia St. | Sun Belt | 2,381 | 238 | 255 | -17 |
| 246 | Western Ill. | Summit League | 3,313 | 237 | 190 | 47 |
| 247 | Jacksonville St. | OVC | 3,085 | 237 | 581 | -344 |
| 248 | McNeese | Southland | 2,368 | 237 | 252 | -15 |
| 249 | Georgetown | Big East | 3,039 | 234 | 240 | -6 |
| 250 | Hartford | America East | 2,561 | 233 | 348 | -115 |
| 251 | Western Caro. | Southern | 2,991 | 230 | 190 | 40 |
| 252 | ETSU | Southern | 1,841 | 230 | 224 | 6 |
| 253 | Jackson St. | Southwestern | 1,827 | 228 | 208 | 20 |
| 254 | Cal St. Fullerton | Big West | 3,370 | 225 | 360 | -135 |
| 255 | George Mason | Atlantic 10 | 2,926 | 225 | 324 | -99 |
| 256 | New Orleans | Southland | 2,475 | 225 | 277 | -52 |
| 257 | Denver | Summit League | 3,356 | 224 | 289 | -65 |
| 258 | Army West Point | Patriot | 3,341 | 223 | 247 | -24 |
| 259 | Winthrop | Big South | 1,997 | 222 | 254 | -32 |
| 260 | Youngstown St. | Horizon | 2,844 | 219 | 258 | -39 |
| 261 | Rhode Island | Atlantic 10 | 2,188 | 219 | 408 | -189 |
| 262 | Appalachian St. | Sun Belt | 2,388 | 217 | 296 | -79 |
| 263 | Saint Mary’s (CA) | West Coast | 2,597 | 216 | 223 | -7 |
| 264 | Albany (NY) | America East | 2,160 | 216 | 229 | -13 |
| 265 | Manhattan | Metro Atlantic | 2,370 | 215 | 236 | -21 |
| 266 | Northeastern | Colonial | 2,572 | 214 | 231 | -17 |
| 267 | Dartmouth | Ivy League | 2,138 | 214 | 210 | 4 |
| 268 | Eastern Ill. | OVC | 2,968 | 212 | 160 | 52 |
| 269 | Hofstra | Colonial | 2,333 | 212 | 213 | -1 |
| 270 | Harvard | Ivy League | 2,479 | 207 | 270 | -63 |
| 271 | Eastern Wash. | Big Sky | 1,659 | 207 | 364 | -157 |
| 272 | Tennessee St. | OVC | 2,268 | 206 | 197 | 9 |
| 273 | Southern U. | Southwestern | 825 | 206 | 99 | 107 |
| 274 | Eastern Mich. | Mid-American | 1,823 | 203 | 294 | -91 |
| 275 | South Carolina St. | Mid-Eastern | 1,422 | 203 | 232 | -29 |
| 276 | Hampton | Mid-Eastern | 1,421 | 203 | 199 | 4 |
| 277 | Presbyterian | Big South | 2,019 | 202 | 305 | -103 |
| 278 | Brown | Ivy League | 1,611 | 201 | 182 | 19 |
| 279 | N.C. Central | Mid-Eastern | 1,607 | 201 | 216 | -15 |
| 280 | Bucknell | Patriot | 2,169 | 197 | 131 | 66 |
| 281 | Eastern Ky. | OVC | 1,760 | 196 | 165 | 31 |
| 282 | Canisius | Metro Atlantic | 2,339 | 195 | 236 | -41 |
| 283 | Providence | Big East | 2,908 | 194 | 191 | 3 |
| 284 | Columbia | Ivy League | 1,740 | 193 | 160 | 33 |
| 285 | Grambling | Southwestern | 1,351 | 193 | 297 | -104 |
| 286 | Duquesne | Atlantic 10 | 2,258 | 188 | 134 | 54 |
| 287 | Stony Brook | America East | 1,503 | 188 | 339 | -151 |
| 288 | Central Conn. St. | Northeast | 1,312 | 187 | 153 | 34 |
| 289 | La.-Monroe | Sun Belt | 1,853 | 185 | 165 | 20 |
| 290 | Binghamton | America East | 1,278 | 183 | 283 | -100 |
| 291 | Marist | Metro Atlantic | 1,968 | 179 | 195 | -16 |
| 292 | Gardner-Webb | Big South | 2,129 | 177 | 524 | -347 |
| 293 | Southeastern La. | Southland | 1,595 | 177 | 169 | 8 |
| 294 | Nicholls St. | Southland | 1,584 | 176 | 255 | -79 |
| 295 | Norfolk St. | Mid-Eastern | 1,233 | 176 | 125 | 51 |
| 296 | Lafayette | Patriot | 2,253 | 173 | 145 | 28 |
| 297 | N.C. A&T | Mid-Eastern | 1,721 | 172 | 116 | 56 |
| 298 | Loyola Maryland | Patriot | 2,045 | 170 | 195 | -25 |
| 299 | Coppin St. | Mid-Eastern | 1,190 | 170 | 103 | 67 |
| 300 | Texas Southern | Southwestern | 1,669 | 167 | 216 | -49 |
| 301 | William & Mary | Colonial | 1,978 | 165 | 261 | -96 |
| 302 | Lehigh | Patriot | 2,607 | 163 | 165 | -2 |
| 303 | Towson | Colonial | 2,097 | 161 | 185 | -24 |
| 304 | Fla. Atlantic | Conference USA | 1,614 | 161 | 149 | 12 |
| 305 | Seattle U | Western Athletic | 1,446 | 161 | 166 | -5 |
| 306 | Stetson | ASUN | 2,063 | 159 | 213 | -54 |
| 307 | Alcorn | Southwestern | 1,721 | 156 | 94 | 62 |
| 308 | UMKC | Western Athletic | 1,527 | 153 | 221 | -68 |
| 309 | Niagara | Metro Atlantic | 1,370 | 152 | 141 | 11 |
| 310 | UMass Lowell | America East | 1,218 | 152 | 197 | -45 |
| 311 | NJIT | ASUN | 1,661 | 151 | 214 | -63 |
| 312 | Robert Morris | Northeast | 1,495 | 150 | 146 | 4 |
| 313 | Charleston So. | Big South | 1,354 | 150 | 349 | -199 |
| 314 | UMBC | America East | 1,327 | 147 | 188 | -41 |
| 315 | Jacksonville | ASUN | 1,594 | 145 | 300 | -155 |
| 316 | UAB | Conference USA | 2,302 | 144 | 231 | -87 |
| 317 | Savannah St. | Mid-Eastern | 1,007 | 144 | 120 | 24 |
| 318 | Saint Francis (PA) | Northeast | 1,472 | 134 | 149 | -15 |
| 319 | Sacred Heart | Northeast | 1,403 | 128 | 285 | -157 |
| 320 | FIU | Conference USA | 1,156 | 128 | 242 | -114 |
| 321 | San Francisco | West Coast | 1,754 | 125 | 201 | -76 |
| 322 | Saint Peter’s | Metro Atlantic | 1,490 | 124 | 90 | 34 |
| 323 | The Citadel | Southern | 1,724 | 123 | 148 | -25 |
| 324 | Holy Cross | Patriot | 1,351 | 123 | 273 | -150 |
| 325 | La Salle | Atlantic 10 | 1,578 | 121 | 107 | 14 |
| 326 | Florida A&M | Mid-Eastern | 841 | 120 | 119 | 1 |
| 327 | Delaware St. | Mid-Eastern | 645 | 108 | 87 | 21 |
| 328 | Iona | Metro Atlantic | 1,155 | 105 | 135 | -30 |
| 329 | St. Francis Brooklyn | Northeast | 1,154 | 105 | 142 | -37 |
| 330 | LIU Brooklyn | Northeast | 1,135 | 103 | 136 | -33 |
| 331 | Fairleigh Dickinson | Northeast | 988 | 99 | 128 | -29 |
| 332 | Siena | Metro Atlantic | 850 | 94 | 148 | -54 |
| 333 | Chicago St. | Western Athletic | 1,153 | 89 | 139 | -50 |
| 334 | Howard | Mid-Eastern | 1,019 | 85 | 204 | -119 |