2017 FIVB VOLLEYBALL WORLD GRAND PRIX
- Group 1
- July 7th – August 6th
- FIVB World Grand Prix Round 3
- Schedule/Results
Note: All attendance figures are direct from the FIVB World League website. If attendance numbers are listed wrong on the site, those errors will throw off this data as well.
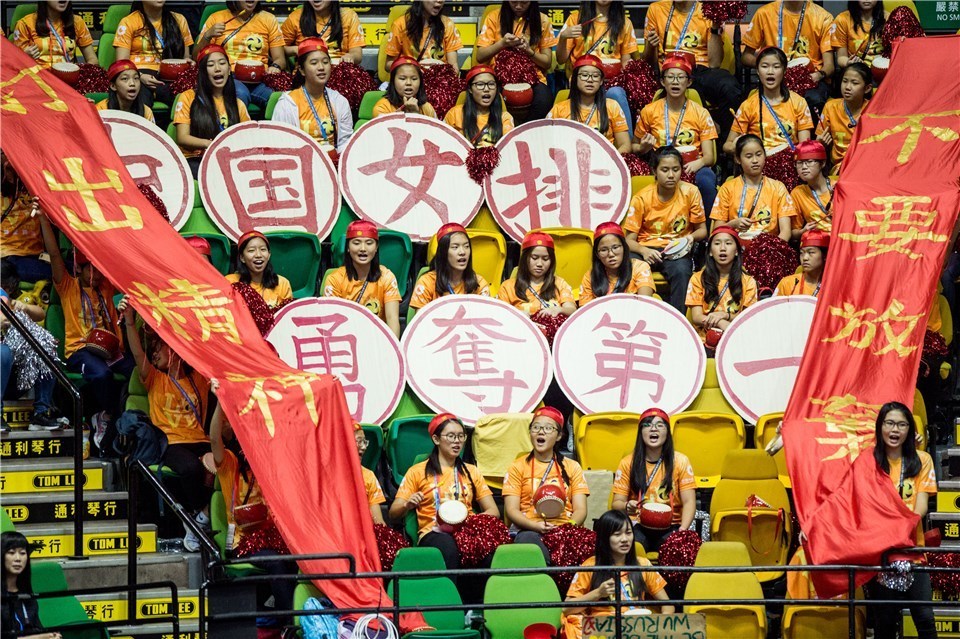
Hong Kong had the highest attendance figures of all 6 Grand Prix Group 1 hosts, but it was Brazil that had the best home court advantage for matches featuring the home team.
Hong Kong led all sites in average attendance by almost 2000 spectators per match, showing up for matches featuring the “home” team (in this case China) and matches between visitors. But Brazilian fans showed the biggest support gap between matches featuring the home team and matches with two visitors. Attendance soared more than 500% for matches featuring Brazil in Cuiaba.
SITE-BY-SITE
Hong Kong had the best average and total attendance, bringing in more than 10,000 more spectators cumulatively than any other site. China hosted a group in all three weekends of play, with Hong Kong topping the list, Macau finishing 4th and Kunshan 6th out of 9 hosts.
| Week | Pool | Site | Average Game Attendance | Total Attendance |
| 3 | G1 | Hong Kong, China | 9509 | 57,051 |
| 3 | H1 | Bangkok, Thailand | 7833 | 47,000 |
| 1 | C1 | Apeldoom, Netherlands | 3645 | 21,870 |
| 2 | E1 | Macau, China | 3551 | 21,305 |
| 3 | I1 | Cuiaba, Brazil | 3530 | 21,179 |
| 1 | B1 | Kunshan, China | 3075 | 18,449 |
| 1 | A1 | Ankara, Turkey | 2700 | 16,200 |
| 2 | D1 | Sendai, Japan | 2542 | 15,250 |
| 2 | F1 | Kaliningrad, Russia | 2167 | 13,000 |
HOME-COURT ADVANTAGE
Attendance averaged just 960 fans for matches in Cuiaba, Brazil not featuring the Brazilian team. But the home team averaged a whopping 6100 fans in that arena, the biggest jump of any host. Fans in China, on the other hand, turned out almost as much to watch two visiting teams as they did to watch the Chinese national team. That was true for both Macau (week 2’s host) and Hong Kong (week 3’s host), though Kunshan (week 1’s host) had a 246% increase in attendance for home matches.
| Week | Pool | Site | Home Team Playing | Home Team Not Playing | % Boost For Home Team Matches |
| 3 | I1 | Cuiaba, Brazil | 6,100 | 960 | 535.38% |
| 1 | A1 | Ankara, Turkey | 4,500 | 900 | 400.00% |
| 1 | B1 | Kunshan, China | 4,773 | 1,376 | 246.82% |
| 2 | F1 | Kaliningrad, Russia | 3,300 | 1,033 | 219.35% |
| 1 | C1 | Apeldoom, Netherlands | 5,100 | 2,190 | 132.88% |
| 2 | D1 | Sendai, Japan | 3,500 | 1,583 | 121.05% |
| 3 | H1 | Bangkok, Thailand | 10,000 | 5,667 | 76.47% |
| 3 | G1 | Hong Kong, China | 10,714 | 8,303 | 29.04% |
| 2 | E1 | Macau, China | 3,975 | 3,127 | 27.13% |
BY DAY
Attendance spiked in the final weekend, more than doubling from the previous two weeks averages. Some of that was the inclusion of Hong Kong as a host (which vastly outperformed any week 1 or week 2 host) and Bangkok, Thailand was the second-most-attended host city, also hosting week 3.
Attendance climbed steadily each weekend, with Sundays pulling in the best crowds and Fridays lagging a bit behind.
| Date | Average Attendance | |
| Friday | 7/7 | 2587 |
| Saturday | 7/8 | 3186 |
| Sunday | 7/9 | 3648 |
| Friday | 7/14 | 2378 |
| Saturday | 7/15 | 2886 |
| Sunday | 7/16 | 2996 |
| Friday | 7/21 | 6259 |
| Saturday | 7/22 | 6729 |
| Sunday | 7/23 | 7884 |
FAST FACTS
A few more fast facts:
- Highest single-match attendance: 11,000, Thailand vs Italy in Bangkok, Thailand
- Lowest single-match attendance: 527, USA vs Belgium in Cuiaba, Brazil
- Highest attendance for a match not involving the host nation: 8360, Serbia vs Russia in Hong Kong
- Lowest attendance for a match involving the host nation: 2600, Russia vs Dominican Republic in Russia
- Number of matches with over 10,000 spectators: 6, (3 in Hong Kong, 2 in Thailand and 1 in Brazil, all in week 3)